One of the main benefits of LEDs when compared to other light sources is the possibility to create a customized spectrum. With a spectrum customized to a specific application, plant morphology, uniformity, quality of yield, time of flowering and other parameters can be better controlled. This benefit of using the light spectrum to control plant growth is even more significant when using LED light in closed environments i.e. as a sole source of light.
When considering LED technology development, lately it has become clear that plants can respond differently when grown under different light sources. Monochromatic lights (e.g. LEDs made up of just red and blue chips) are usually lacking behind in plant responses when compared against a continuous (full / wide) spectrum where the different colour wavelengths are overlapping. Beyond just how rich the spectrum is with various spectrum colors we also have to consider different color ratios as a contributing factor such as the red to far red (R:Fr) ratio and the blue to green (B:G) ratio.
Different Kinds Of White LED Light Induce Different Plant Responses
Red to far-red ratio (R:Fr)
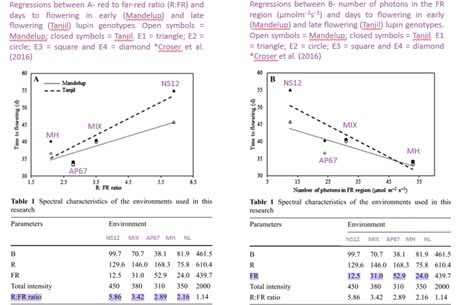
Most research on plant responses has been done in regards to the red to far red ratio. Plant leaf surface contains red and far-red light absorbing photoreceptors called phytochromes-B (phyB). PhyB switches between the biologically inactive (Pr, λmax, 660 nm) and active (Pfr; λmax, 730 nm) forms.
These forms directly affect the photomorphogenesis, like elongation, germination and flowering of plants (Franklin and Whitelam 2005). This is a good example that it is not only the percentage amount of far-red and red that matters in the continuous LED light spectrum but the relationship between them and the photon load the spectrum produces (Croser at al. 2016).
There are different definitions of what colour a certain wavelength is referring to. According to Sellaro et. al. (2010) red light is between 620-680 nanometers and far red between 700-750 nanometers. An older definition by Smith (1982) determines the red to be between 700-750 nanometers and the far red between 720-740 nanometers.
If we analyse the scientific literature we can notice that the red to far red ratio is described be relatively low (2-3) to resemble sunlight, which has a R:Fr ratio of around 0.6-1.3 (0.6 at the morning and evening and 1.0-1.3 at high noon). The higher the R:Fr ratio gets, the more compact the plant will be and vice versa.
Plants also sense increased amounts of far red in the spectrum and interpret the high amounts as being in the shadow. This leads to the so-called “shade avoidance syndrome”, which leads to a stretched stem and earlier flowering.
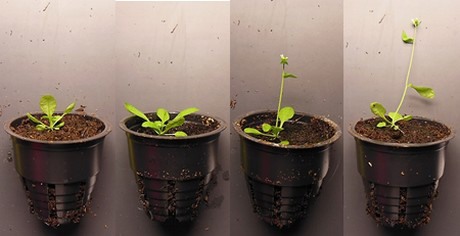
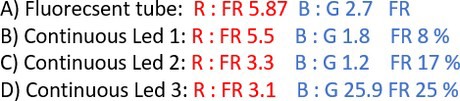
Plants shown above are 27 days old Arabidopsis thaliana seedlings grown under different light treatments each of 40 µmol/m-2/s-1.
Blue to green ratio (B:G)
Blue color in the spectrum is critical to the photosynthetic process and is thus together with the red color the basis of constructing a good grow light spectrum. The effect of the blue color however is significantly affected by the blue to green color ratio (Möglich et al. 2009). In more recent academic literature even more emphasis has been placed on the green color wavelength.
It is now known that it penetrates deeper into the leaves’ mesophyll layers than the blue and red wavelengths. Furthermore, we now know it to be able to penetrate through the upper leaves to the lower parts of the plant and drive photosynthesis where other wavelengths are at limited supply (Smith et al. 2017).
A direction for future research may be to study the green to red ratio because green is known for affecting the red light responses also.
Advice for growers
Constructing a high quality light spectrum is a complex process that ideally rests on solid scientific research. With a myriad of lighting companies bringing their offerings to the market it may feel overwhelming for growers to understand what kind of light will feed their plants best.
It is always good to acquire a few test lights from various manufacturers and test them to understand how they affect plant parameters important to a particular grower. Beyond that, it is good to request the lighting suppliers to provide data from the research they had conducted as proof that their spectra had been carefully developed and that they in fact can back up their claims.
8 Tips For Setting Up Successful Plant Trials With LED
For more information on Valoya’s spectra, please contact Valoya at www.valoya.com/contact
Valoya will be exhibiting at GreenTech 2019. Visit Valoya at booth #08.217 to learn about the latest developments in the LED technology.