It can be a challenge for a grower to get sufficient PAR light insights that are collected with the 30MHz sensors. This article describes a dashboard model where the PAR Light data in combination with other sensor values are visualized. Three tips for carefully measuring PAR light data and a manual for setting up a PAR dashboard on the 30MHz platform:
Tip 1: Visualise your Light averages per day and week in mol/m2/seconds
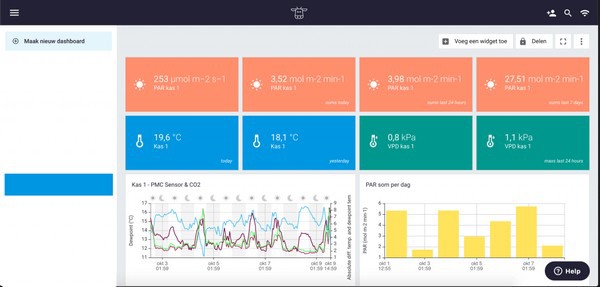
My goal is to achieve a high growth speed with the right quality for my customers. Important metrics are Light in micromole and averages per day and week in mol/m2/seconds to achieve this. The following layout is most suitable to get these PAR Light insights:
Tip 2: Flatten your peaks and you can work with a higher PAR sum
With too many peaks in these conditions, the leaves of your crop will turn yellow and you will need to screen to avoid this. If you can’t control your peaks, you will probably lower your total PAR sum to keep the colors of the leaves in the right condition.
If you can flatten your peaks, you can work with a higher PAR sum. This will result in a better crop quality and a higher growth speed.
Tip 3: It is important to have a weekly dashboard that visualizes the data per day
An important component is the combination of PAR sum per day with the 24h average temperature. If you can reach a higher PAR sum, you can realize a higher 24h average temperature without any stretching. That is why it is so important to control this every day within the dashboard. Notifications in the dashboard can help you to realize this goal.
As a day never can be the same, it is important to have a weekly dashboard that visualizes the data per day. This can be visualized in the dashboard with a bar chart. If the weather is changing and e.g. the light intensity is decreasing, you can decide to change your screening strategy.
Required sensors
Of course, you will need to have the following sensors at your greenhouse to be able to create the PAR dashboard:
PAR sensor
This rugged sun calibration quantum sensor was designed to measure the strength of natural sunlight. Use the PAR to measure PPFD (Photosynthetic Photon Flux Density) in agricultural environments including greenhouses, growth chambers, or outdoor plant canopy environments.
Pointed micro climate sensor
This sensor uses leaf temperature and temperature humidity measurements to continuously capture microclimate at close range. Use data from the sensor to better determine heating needs, cutting unnecessary energy expenditures and lowering the risk of plant fungus and disease.
For more information: 30MHz
30MHz
Zekeringstraat 36A
1014 BS Amsterdam
The Netherlands
support@30mhz.com
www.30mhz.com