The Red Sea crisis has been going on for a month now, and the current service networks are clearly in flux, with a lot of uncertainty, especially on the services going from Asia to Europe. Using our Trade Capacity Outlook report, we can compare the present changes with normal volatility, as well as with the market disruptions over the past few years.
 Click here for a larger image.
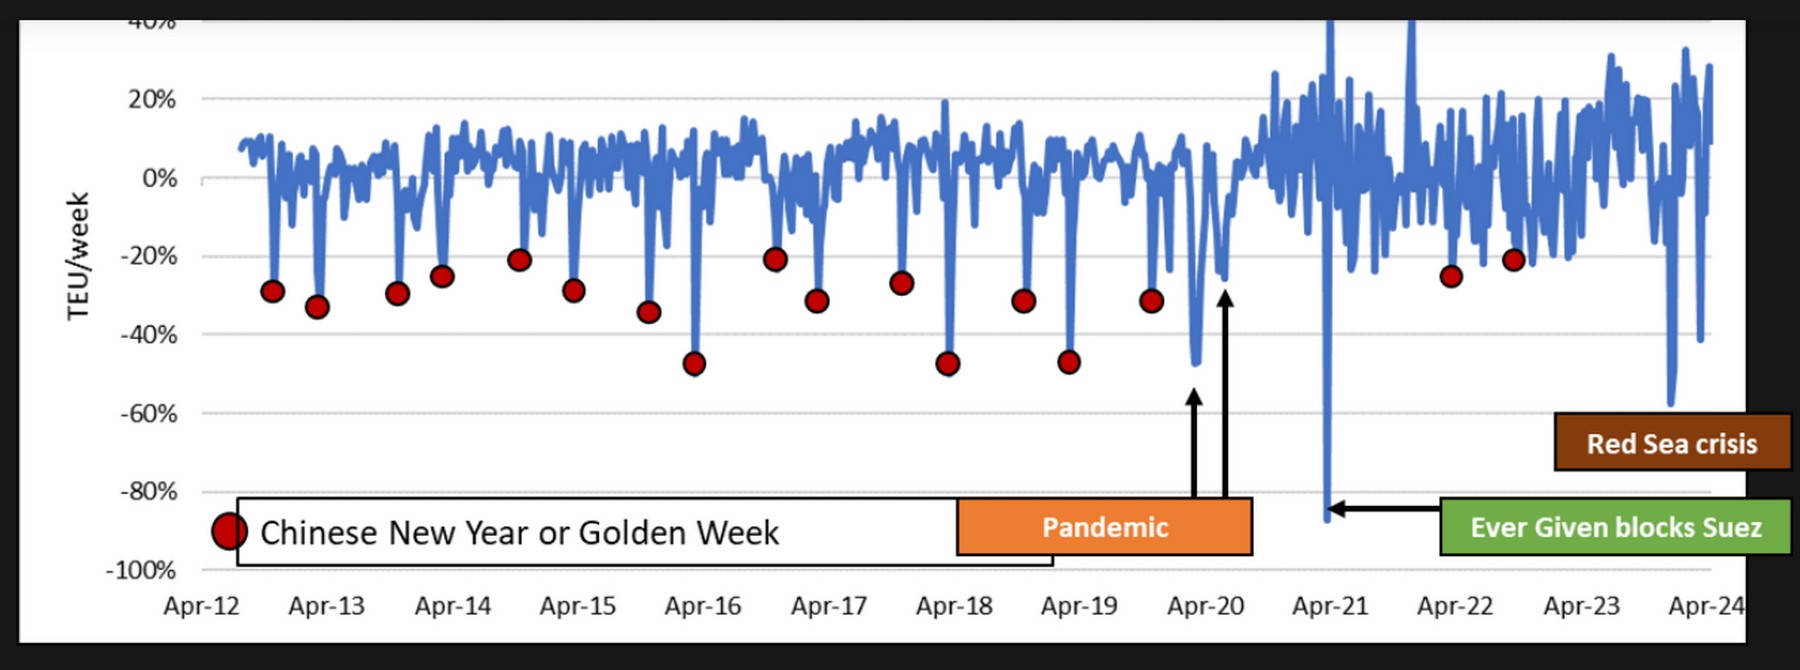
The red circles are all marking Chinese New Year/Golden Week, where capacity declines are catered to demand shortfalls occurring because of these holidays and, as such, are seen as normal market behavior. The two phases of the pandemic are marked with green arrows – the first phase, when it only impacted Chinese ports, and the second, when it spread globally.
We have marked the “Ever Given” event, and this is clearly seen to have the largest single impact. It should be noted, though, that part of this ended up overlapping with capacity changes related to Chinese New Year that year. Finally, we can very clearly see the Red Sea crisis. With the “Ever Given” as the only exception, this is the largest single event – even larger than the early pandemic impact.
For more information: sea-intelligence.com